Logs and monitoring
Last updated
Was this helpful?
Last updated
Was this helpful?
Job logs
For all data generation jobs, the job logs provide detailed information about the job processing. Syntho support might request the job logs to help diagnose issues.
Go to your workspace, select Jobs > Job history > Job summary and select the Download logs button to download the logs of a data generation job.
To avoid leaking values, by default Syntho prevents including sensitive values or redacts sensitive values (e.g. passwords) from the logs.
Syntho uses Ray to scale workloads.
Go to your workspace, select Jobs > Job history > Job summary and select the Ray dashboard button to view the Ray cluster utilization dashboard.
Syntho utilizes Ray for executing long-running tasks such as synthesizing, PII scans, and FK scans. To monitor these tasks, the Ray dashboard provides a real-time overview of job execution, system resource usage, and logs.
By leveraging the Ray dashboard, you can efficiently track job execution, detect potential bottlenecks, and access relevant logs to troubleshoot issues.
Jobs tab displays all running and past jobs. A constant background job from the Core API ensures system health. You can access job-specific logs, flame graphs, and execution details via the Actions column.
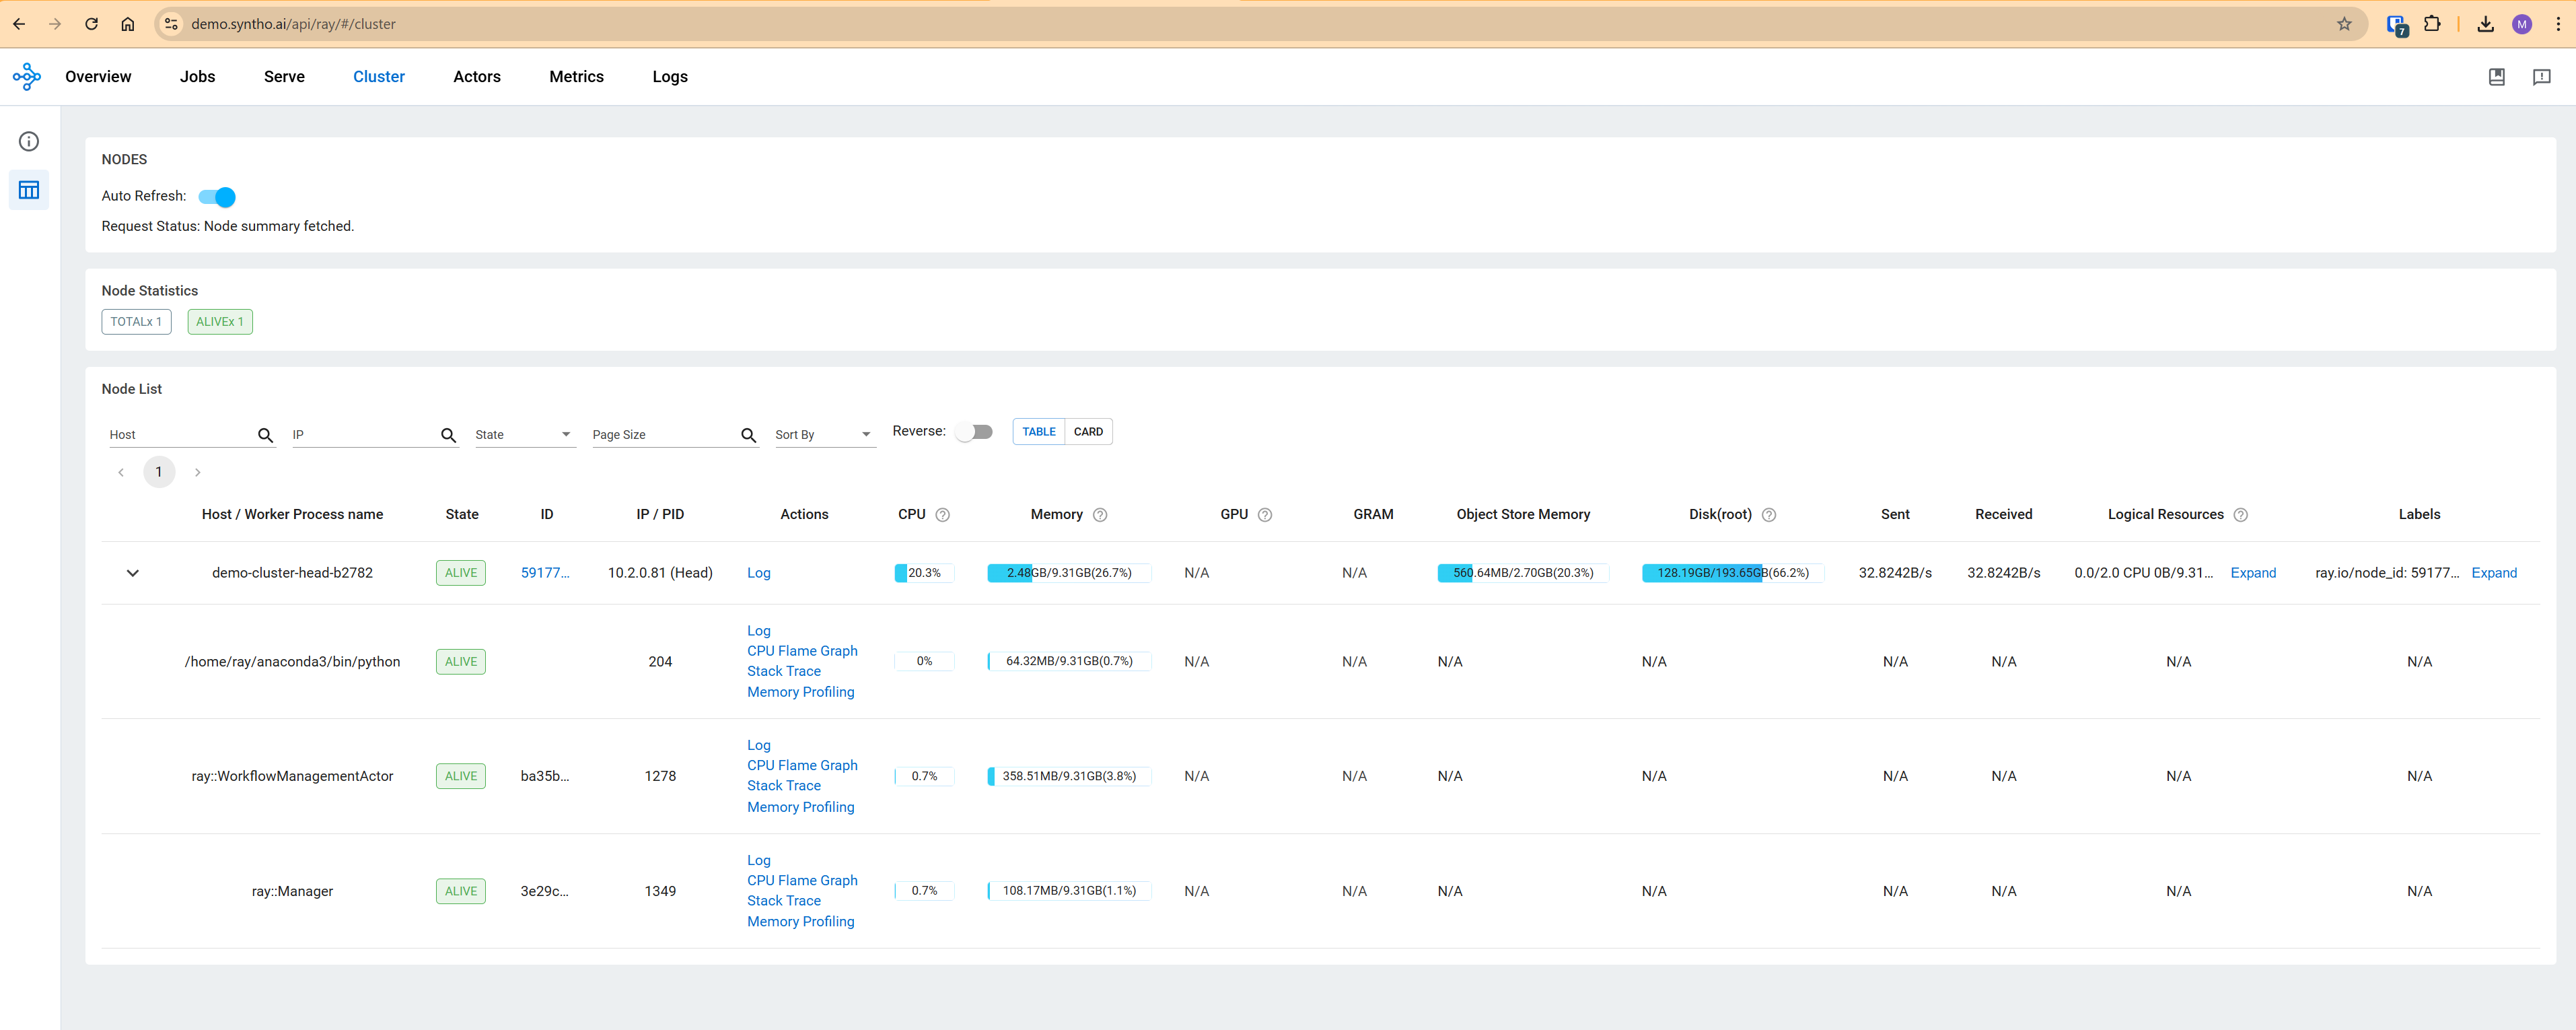
Cluster tab provides a summary of all active Ray nodes, including key resource metrics like CPU, memory, and disk usage. You can click on a node ID to reveal a detailed performance breakdown.
Actors tab lists active and dead actors. While generally not needed, you can inspect memory consumption per actor if required.
For real-time tracking of synthesizing, PII scans, or FK scans:
Start the job and open the Ray dashboard.
Use the Cluster tab to monitor resource consumption.
Upon completion, check the Jobs tab for job status updates (success or failure).
Note that Syntho does not use Ray Serve, so this section in the dashboard is not applicable.