AI-generated synthetic data
This guide provides the step-by-step procedures for AI-generated synthetic data for a single entity table.
The diagram below illustrates a workflow for AI-generated synthetic data. Detailed information about each step shown in the diagram is provided throughout this page.

Before starting AI-generated synthetic data use case, check the video below that provides a short introduction to data generators.
For this key use case, a single table, named census, containing census-collected data, requires to be synthesized using Syntho's AI-powered generation. Maximum privacy, alongside the generation of highly realistic data that statistically reflects the original dataset, is crucial for AI and analytics. The initial step involves creating a workspace in Syntho, linked to a census database. Once established, this workspace will feature the census table exclusively. Below, the table's columns and a sample of the contained data are presented.

For prerequisites check Prerequisites or watch the video below.
Preparing your data
For AI-powered synthetic data generation, ensure your data is fit to synthesize. Syntho expects your data to be stored in an entity table that adheres to specific guidelines:
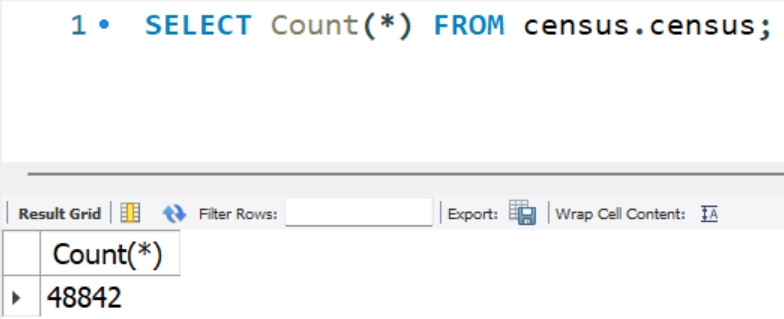
Maintain a minimum column-to-row ratio of 1:500 for privacy and algorithmic generalization. With 15 columns, aim for at least 7,500 rows; our example database exceeds this with 48,842 rows (see below illustration).
Describe each entity in a single row, ensuring row independence without sequential information. That means each row can be treated independently. The order of the rows does not convey any information. The contents of one row also do not affect other rows.
Remove columns that are derived directly from other columns and not contain additional information. For example, you may have a redundant duration column that is derived from the start_time and end_time columns. For categorical columns, there could be hierarchical relationships, such as a redundant Treatment category column referring to a Treatment Type column. Removing such columns containing redundant information will simplify the modeling process and will lead to higher quality synthetic data. If not removed, such columns constructed with calculated columns feature.
Avoid column names with privacy-sensitive information, like patient_a_medications, patient_b_medications, etc. Instead, simply have a patient column with the names in it. This prevents patient names from being exposed in metadata or bypass rare category protection (e.g., there’s a patient_a column, but this patient only appeared five times in the whole dataset).
Our example table fully meets these criteria.
Configuring Column Settings
Under Column settings > Generation Method, select AI-powered generator for Syntho's ML models to synthesize data.
This feature helps hide sensitive or rare observations, like specific occupations in the census table, by replacing them with a user-defined value, enhancing data privacy. Adjust the rare category protection threshold and replacement value in Column settings > Encoding type > Advanced settings.
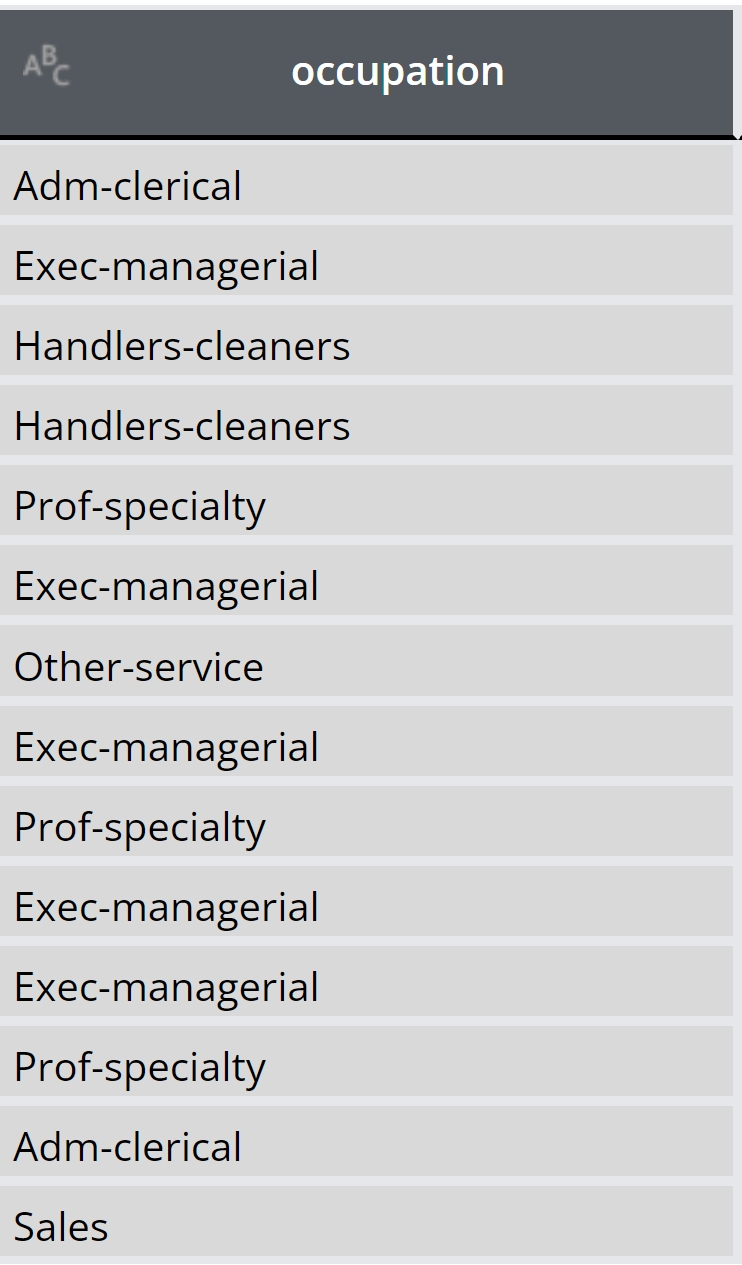
Rare category protection threshold: All column values that occur as frequently or less than the rare category protection threshold are automatically replaced.
Rare category replacement value: All column values that occur as frequently or less than the rare category protection threshold are automatically replaced by this replacement value.
For example, occupations appearing as frequently or less than 15, will be replaced with the sign asterisk or “*”. The number and replacement value are voluntarily and can be defined per user request (See below illustration).

PII scanner and Mockers
In the PII tab, you can add new columns to the list of PII columns, either manually or by using Syntho's PII scanner. You have the option to manually label columns containing PII by selecting the column name and optionally choosing a mocker to apply. Clicking "Confirm" will mark the column as containing PII and confirm the mocker selection.
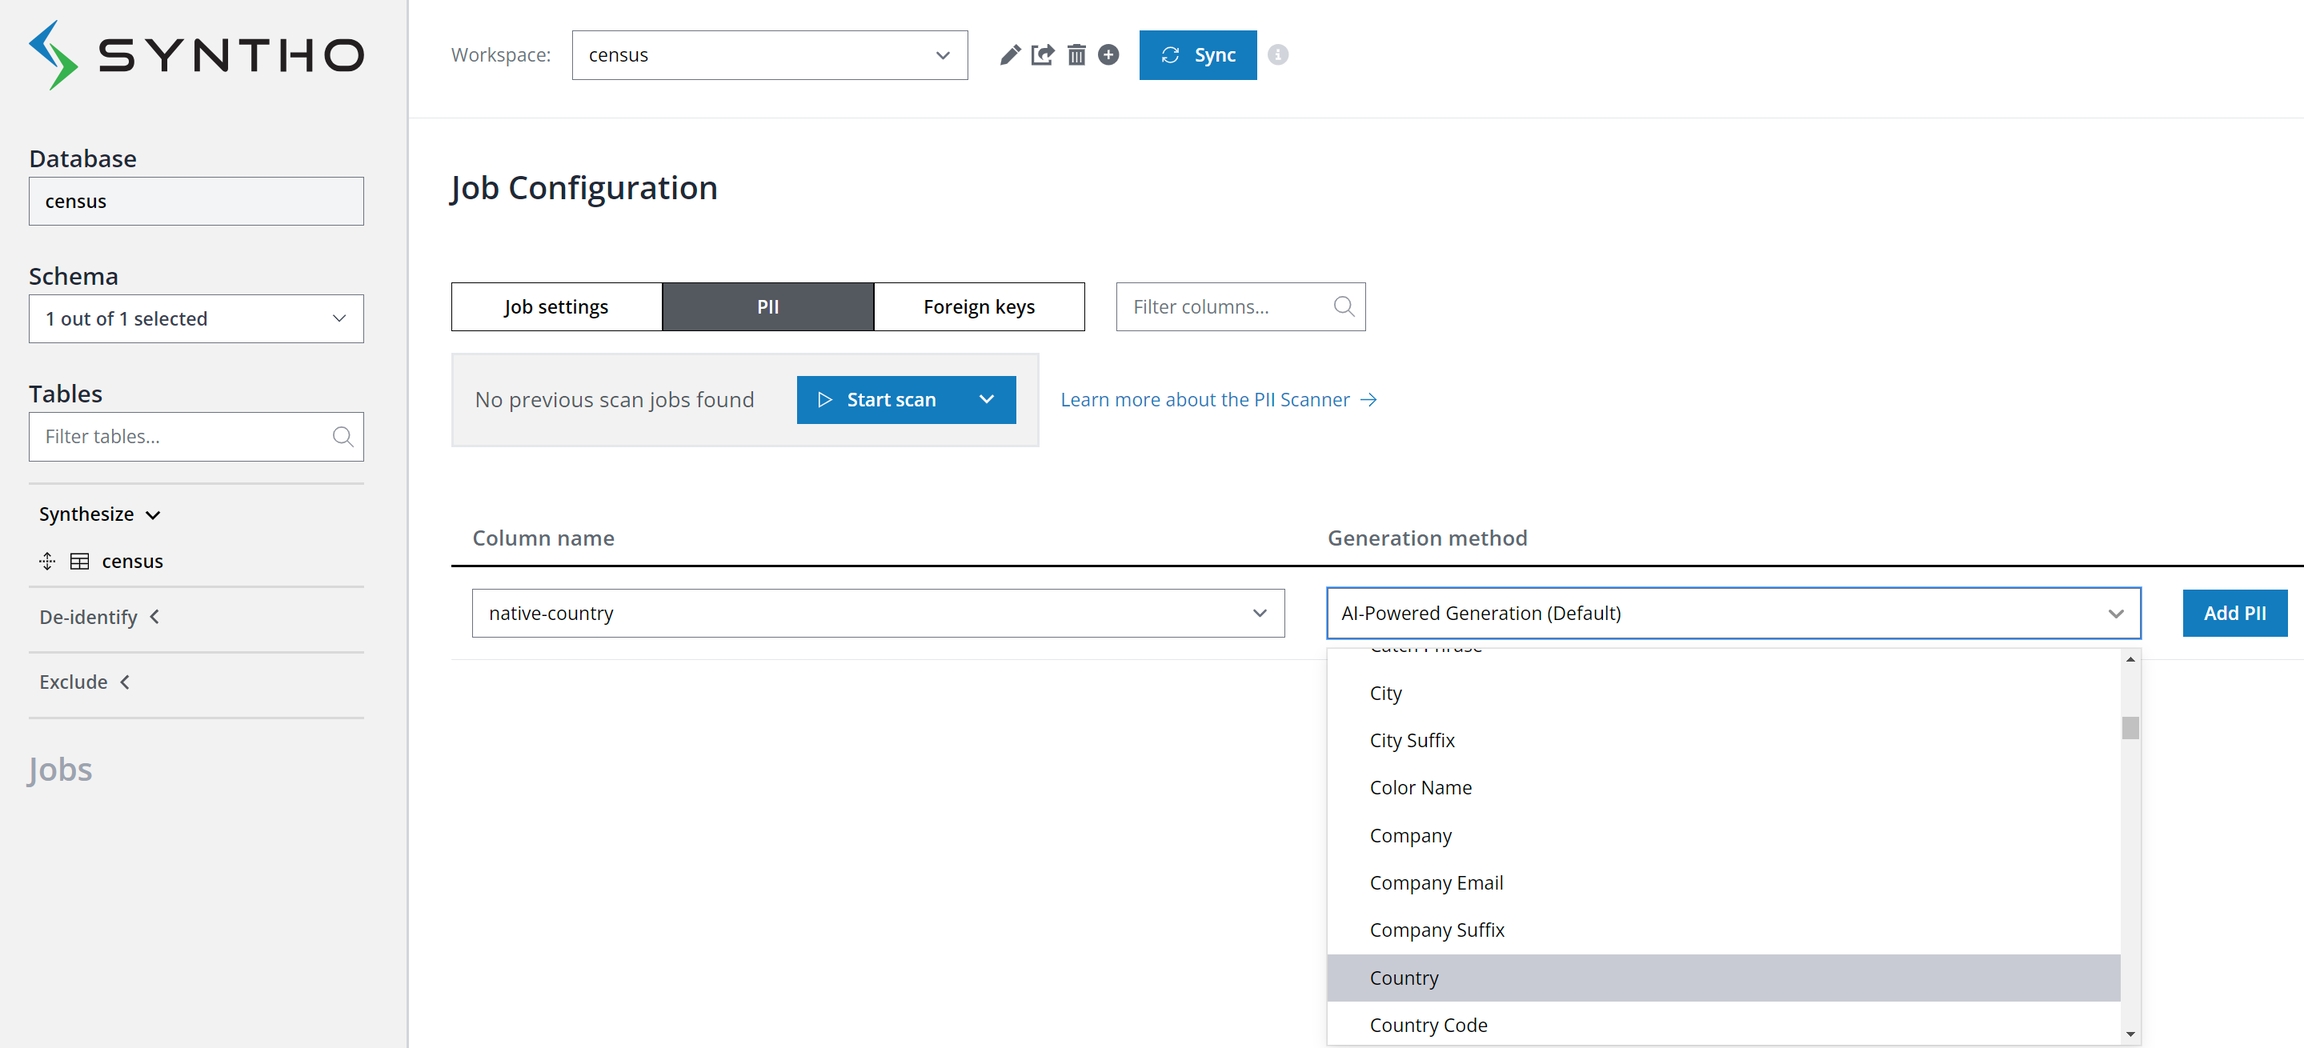
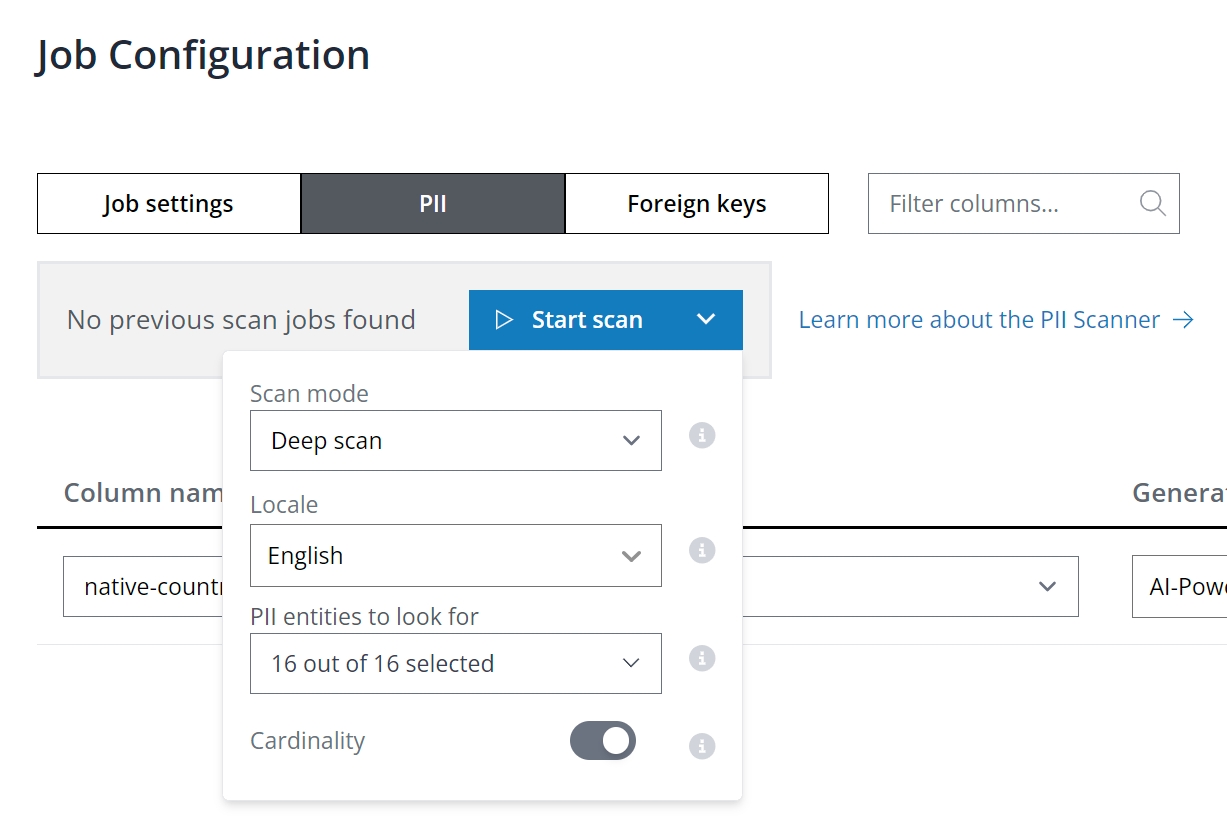
Alternatively, deploy automatic PII discovery with the PII scanner. Launch a scan to detect PII across all database columns from the PII tab in the Job Configuration panel. Note that the scanner offers both Shallow and Deep scan modes:
The shallow scan assesses columns using regular expression rules to identify PII, optimized for speed but with variable accuracy.
The deep scan examines both metadata and data within columns for a thorough PII identification.
As with de-identification, you can use mockers or exclude to replace any PII columns. If not, those PII columns will be treated as categorical columns and processed by Syntho's “Rare category protection”.
In the job settings, under table settings, you can adjust generator-level settings, including the maximum number of rows for training to optimize speed. Leaving this setting as None utilizes all rows. The Take random sample option allows for sampling:
On: Random rows are selected for training.
Off: Top rows as per the database are used.
Start data generation process
To start data generation, you can do the following:
On the Job configuration panel, select Generate.
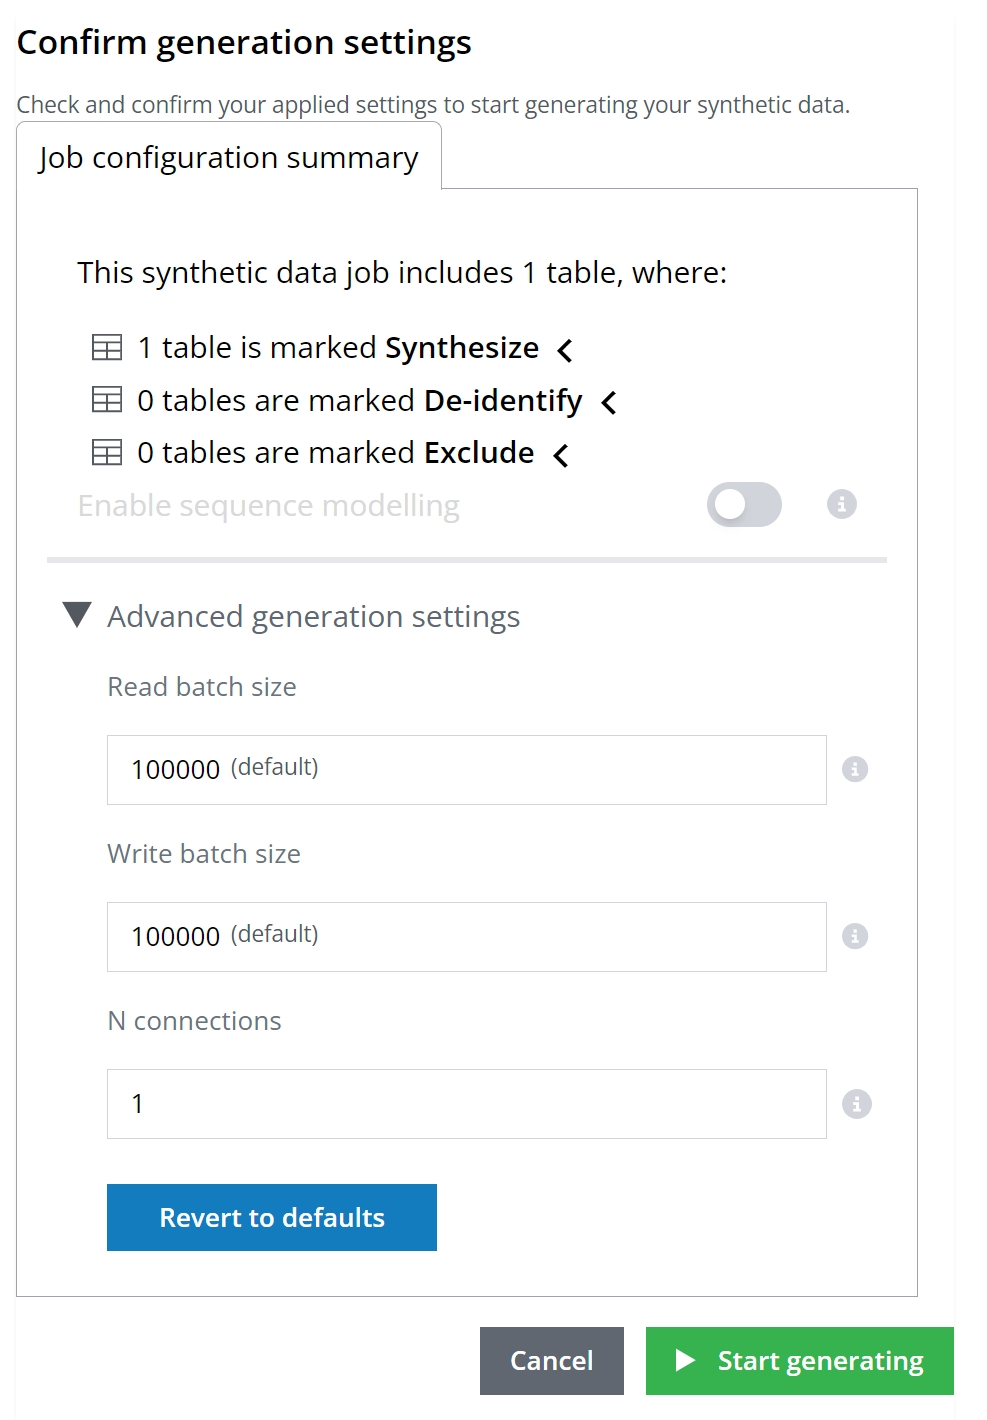
On the Job configuration summary panel, adjust generation parameters as desired.
Finally, select Start generating.
Before initiating the generation process, you have the option to modify model parameters. Here's an overview:
Read batch size: The number of rows read from each source table per batch.
Write batch size: The number of rows inserted into each destination table per batch.
N connections: Specifies the number of connections.
Truncate tables before each new data generation job
Users are required to manually TRUNCATE their tables in the DESTINATION database before initiating each new data generation job. If truncation is hindered due to existing constraints, these constraints should be temporarily disabled before truncation and then re-enabled afterwards. For instance, to facilitate the truncation process when foreign key constraints prevent it, use the following SQL commands: First, disable the constraints by executing SET FOREIGN_KEY_CHECKS = 0;, then TRUNCATE the table, and finally, re-enable the constraints with SET FOREIGN_KEY_CHECKS = 1;. This sequence ensures that tables are properly prepared for data generation without constraint violations.
Evaluation
SDMetrics is an open-source Python library designed for evaluating tabular synthetic data to determine how closely it mimics the mathematical properties of real data, known as synthetic data fidelity, through selective metric evaluation, detailed results explanation, score visualization, and report sharing capabilities.
For full metrics and information, please check the SDMetrics documentation by clicking on this link.
In the notebook below, we compare some real and synthetic demo data using SDMetrics based on SDMetrics original notebook. Also, you will find a shareable report, and you can use it to discover some insights and create visual graphics.
Last updated
Was this helpful?

